Exploratory Data Analysis (EDA) Basics
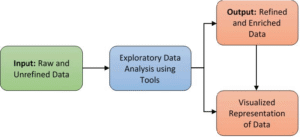
Exploratory Data Analysis (EDA) is the critical first step in the data analysis process. It involves examining datasets to summarize their main characteristics, identify patterns, detect anomalies, and test underlying assumptions — all before applying more complex statistical or machine learning techniques. EDA helps analysts understand what the data is telling them, allowing for better modeling, decision-making, and communication of insights.
Purpose of EDA
- Understanding the Dataset: EDA helps get familiar with the structure, size, shape, and contents of a dataset.
- Detecting Errors or Outliers: It allows you to spot unusual or incorrect values that could skew your results.
- Uncovering Patterns and Relationships: By visualizing and summarizing data, EDA reveals relationships between variables and emerging trends.
- Guiding Further Analysis: EDA informs how to clean, transform, or model data effectively.
Key Components of EDA
Data Collection and Loading: Ensuring the data source is correct and reliable.
Data Structure Examination:
- Check for data types (categorical, numerical, dates, etc.).
- Count rows and columns to understand dataset size.
Summary Statistics:
- Mean, median, mode, range, standard deviation.
- Identify minimum, maximum, and percentile values to detect skewness or outliers.
Data Cleaning:
- Handle missing values (remove, fill, or infer).
- Correct formatting issues or inconsistent labeling.
Outlier Detection:
- Identify values that fall outside expected ranges.
- Use box plots or z-scores conceptually to understand outliers.
Correlation Analysis:
- Understand how different variables relate (positive/negative correlations).
Visual Exploration:
- Use charts like histograms, bar charts, scatter plots, and box plots to find distributions and relationships.
Types of Variables in EDA
- Numerical Variables: Represent measurable quantities (e.g., age, income).
- Categorical Variables: Represent groups or labels (e.g., gender, department).
- Time-Based Variables: Represent dates or times (e.g., sales by month).
Understanding variable types helps in choosing the right summary statistics and visual tools during EDA.
Why EDA Matters
- Builds Data Intuition: You develop a strong understanding of your dataset.
- Prevents Errors Later: Catching issues early avoids complications in modeling.
- Saves Time: Clean and well-understood data leads to more effective analysis.
- Enhances Insight Quality: A good EDA can reveal key business insights even before formal modeling begins.
Conclusion
Exploratory Data Analysis is like getting to know a new city before navigating it. By exploring the layout, understanding key landmarks, and noticing potential roadblocks, you set yourself up for a smoother journey. In the same way, EDA equips analysts with the foundational understanding required to unlock real value from data in any analytics or data science project.
