Descriptive vs. Inferential Statistics
Statistical analysis in analytics typically falls into two broad categories: Descriptive Statistics and Inferential Statistics. Understanding their differences is essential before applying them to any dataset or business problem.
Descriptive Statistics: Summarizing the Data You Have
Descriptive statistics are used to organize, summarize, and describe the features of a specific dataset. This includes raw numerical data, trends, and visual summaries.
Key Characteristics:
- Works on entire datasets (no generalization).
- Helps understand data patterns at a glance.
- Often used in dashboards, reports, and summaries.
Common Descriptive Tools:
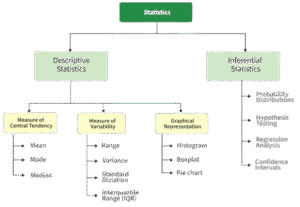
- Measures of Central Tendency: Mean, Median, Mode.
- Measures of Dispersion: Range, Variance, Standard Deviation.
- Visual Tools: Histograms, Bar Charts, Box Plots.
Example:
If Zomato wants to know the average delivery time of restaurants in Delhi based on all orders last month, descriptive statistics will provide that summary.
Inferential Statistics: Making Predictions or Decisions
Inferential statistics are used when you want to draw conclusions or make predictions about a larger population based on a sample of data.
Key Characteristics:
- Works on samples, not full datasets.
- Involves probability, estimation, and hypothesis testing.
- Commonly used when it’s not practical to collect data from every subject.
Common Inferential Methods:
- Confidence Intervals
- Hypothesis Tests (e.g., t-tests, chi-square tests)
- Regression Analysis
- ANOVA
Example:
If YouTube wants to predict average watch time per user across India by analyzing only 1,000 user accounts, it uses inferential statistics to generalize findings from the sample.
Comparison Table
| Feature | Descriptive Statistics | Inferential Statistics |
|---|---|---|
| Purpose | Describe & summarize data | Draw conclusions & make predictions |
| Based on | Full dataset | Sample from a population |
| Tools Used | Mean, SD, Graphs | t-tests, Regression, Confidence Intervals |
| Outcome | Snapshot of data | Generalized insight or decision |
