Introduction to Data Visualization
Data Visualization is the graphical representation of information and data. It helps transform large and complex datasets into visual formats like charts, graphs, and maps, making it easier to understand patterns, trends, and insights at a glance. As data continues to grow in volume and complexity, data visualization has become an essential skill for any data analyst.
Why Is Data Visualization Important?
- Simplifies Complexity: Raw data can be overwhelming. Visuals like bar charts or heatmaps simplify the understanding of large datasets by summarizing and organizing information effectively.
- Enhances Decision-Making: Visuals enable quicker comprehension of trends, anomalies, and outliers, leading to faster and more confident business decisions.
- Improves Communication: A well-crafted visual tells a story that can be easily shared with stakeholders, clients, or team members who may not be data-savvy.
- Reveals Hidden Patterns: Data relationships that might go unnoticed in raw formats can become clear and actionable through visualizations.
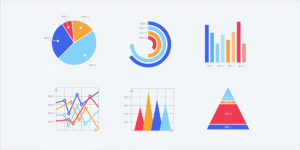
Common Types of Data Visualizations
- Bar Charts & Column Charts: Great for comparing values across different categories.
- Line Charts: Best used to show trends over time.
- Pie Charts: Useful for showing parts of a whole, though limited in accuracy.
- Histograms: Ideal for showing frequency distributions of numerical data.
- Scatter Plots: Help identify correlations between two variables.
- Heatmaps: Represent data values with color, helpful for understanding density and intensity.
- Dashboards: Combine multiple visuals to provide a high-level overview of key metrics.
Tools Used in Data Visualization
There are various tools and platforms available for creating data visualizations, ranging from simple to advanced:
- Microsoft Excel: Basic charts and pivot tables
- Google Data Studio / Looker Studio: Cloud-based and good for real-time dashboards
- Tableau: Powerful and interactive visuals, widely used in industry
- Power BI: Microsoft’s analytics tool that integrates well with other services
- Python & R (Libraries like Matplotlib, Seaborn, ggplot2): For custom and programmatic visualizations
Best Practices in Data Visualization
- Know Your Audience: Tailor visuals to their level of understanding and interests.
- Use the Right Chart Type: Match your data type and message with the appropriate visual.
- Keep It Simple: Avoid unnecessary clutter, 3D effects, or too many colors.
- Label Clearly: Always label axes, data points, and include legends where needed.
- Highlight Key Insights: Draw attention to important trends or anomalies.
Conclusion
Data visualization is not just about making data look good—it’s about making data meaningful. As an analyst, your ability to visualize data effectively is what turns raw numbers into powerful stories that drive action. Mastering this skill will enable students to not only interpret data more efficiently but also to communicate findings in a way that resonates with others.
