Power Analysis & Confidence Intervals
When we make decisions based on data, we want those decisions to be statistically reliable. Confidence intervals help us understand the range in which a result is likely to fall, while Power Analysis helps us decide how much data we need before even starting an experiment.
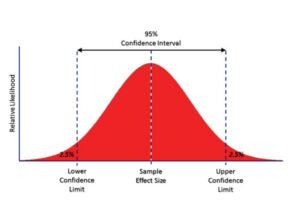
Confidence Intervals (CIs)
A Confidence Interval is a range of values that’s likely to contain the true population parameter (like the mean) with a certain level of confidence (usually 95%).
Key Concepts:
- Point Estimate: Sample statistic (like mean)
- Margin of Error: Based on sample variability and size
- Confidence Level: How sure we are (e.g., 95%)
Formula (for mean):
CI=xˉ±z∗(σn)text{CI} = bar{x} pm z^* left(frac{sigma}{sqrt{n}}right)
Where:
- xˉbar{x} = sample mean
- z∗z^* = z-score (e.g., 1.96 for 95%)
- σsigma = standard deviation
- nn = sample size
Example:
You analyze Zomato delivery times for a city. The sample mean is 32 mins. With 95% confidence, the delivery time is between 30 to 34 minutes. That’s the confidence interval.
Interpreting Confidence Intervals
- A 95% confidence interval means: “If we repeated this study 100 times, the true mean would lie within our interval 95 times.”
- Narrower intervals = more precision → comes from larger sample size or lower variability
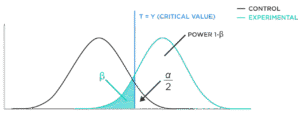
Power Analysis
Power is the probability that your test will detect an effect when there is one (i.e., reject H₀ correctly). It helps in planning experiments.
Why Power Matters:
- Avoids Type II error (false negative)
- Helps determine how large a sample size you need
A typical goal:
- Power ≥ 0.8 → means you have an 80% chance of detecting a real effect
Factors affecting Power
- Effect size – how big the expected difference is
- Sample size – more data → higher power
- Significance level (α) – usually 0.05
- Variability in the data
Real-Life Example:
Imagine you work at Cult.Fit and want to test a new app layout to improve user engagement.
- You expect a 10% increase in workout sessions.
- Power analysis tells you: “To detect this effect with 80% power at α = 0.05, you need 500 users per group.”
Without enough power, your test may fail to detect real improvements—even if they exist.
Summary:
- Confidence Interval → Helps you report results with a margin of certainty.
- Power Analysis → Helps you design experiments effectively before starting.
