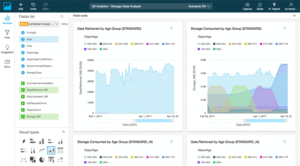
Visualization using Amazon QuickSight
Once data is collected, stored, and processed, the next step is to visualize insights to support data-driven decisions. Amazon QuickSight is AWS’s cloud-native business intelligence (BI) tool that enables users to create interactive dashboards, reports, and data stories—all within the AWS ecosystem.
What is Amazon QuickSight?
Amazon QuickSight is a serverless BI service that allows users to:
- Connect to various AWS data sources (like S3, Redshift, Athena, RDS)
- Create interactive charts and dashboards
- Perform ad-hoc analysis with little or no coding
- Share insights with teams securely via the cloud
Key Features
1. Multiple Data Source Connectivity
QuickSight can connect directly to:
- Amazon S3 (through Athena or Glue Catalog)
- Amazon Redshift
- Amazon RDS (MySQL, PostgreSQL)
- AWS Athena (query data from S3)
- Excel/CSV files and on-prem databases
2. Rich Visualization Options
- Bar, Line, Pie, Scatter, Combo charts
- Geographical maps
- KPIs and Pivot Tables
- Forecasting and anomaly detection (built-in ML)
3. SPICE Engine
SPICE (Super-fast, Parallel, In-memory Calculation Engine) allows:
- High-speed query performance
- Scalability without managing infrastructure
- Better performance on large datasets
4. Interactive Dashboards
- Filter controls (drop-downs, sliders)
- Drill-down into metrics (e.g., from total sales to city-level data)
- Dashboard sharing via web links or AWS IAM controls
Real-World Example: Food Delivery App
Let’s say a food delivery company stores order data in Amazon Redshift. A data analyst can use QuickSight to:
- Visualize average delivery time per city
- Build a map chart showing order density
- Create bar charts of popular cuisines by region
- Add interactive filters for dates, restaurants, or order value ranges
The dashboard is shared with operations managers so they can take quick decisions to improve delivery performance.
Steps to Create a QuickSight Dashboard
- Connect to a Data Source: Choose S3, Athena, Redshift, etc.
- Prepare Data: Clean and transform data if needed (can use Glue or SQL)
- Build Analyses: Add visualizations to answer key questions
- Customize & Filter: Add filters, parameters, controls
- Publish as Dashboard: Share with users across the organization
