Introduction to High-Level System Design
System Design Fundamentals
- Functional vs. Non-Functional Requirements
- Scalability, Availability, and Reliability
- Latency and Throughput Considerations
- Load Balancing Strategies
Architectural Patterns
- Monolithic vs. Microservices Architecture
- Layered Architecture
- Event-Driven Architecture
- Serverless Architecture
- Model-View-Controller (MVC) Pattern
- CQRS (Command Query Responsibility Segregation)
Scaling Strategies
- Vertical Scaling vs. Horizontal Scaling
- Sharding and Partitioning
- Data Replication and Consistency Models
- Load Balancing Strategies
- CDN and Edge Computing
Database Design in HLD
- SQL vs. NoSQL Databases
- CAP Theorem and its Impact on System Design
- Database Indexing and Query Optimization
- Database Sharding and Partitioning
- Replication Strategies
API Design and Communication
Caching Strategies
- Types of Caching
- Cache Invalidation Strategies
- Redis vs. Memcached
- Cache-Aside, Write-Through, and Write-Behind Strategies
Message Queues and Event-Driven Systems
- Kafka vs. RabbitMQ vs. SQS
- Pub-Sub vs. Point-to-Point Messaging
- Handling Asynchronous Workloads
- Eventual Consistency in Distributed Systems
Security in System Design
Observability and Monitoring
- Logging Strategies (ELK Stack, Prometheus, Grafana)
- API Security Best Practices
- Secure Data Storage and Access Control
- DDoS Protection and Rate Limiting
Real-World System Design Case Studies
- Distributed locking (Locking and its Types)
- Memory leaks and Out of memory issues
- HLD of YouTube
- HLD of WhatsApp
System Design Interview Questions
- Adobe System Design Interview Questions
- Top Atlassian System Design Interview Questions
- Top Amazon System Design Interview Questions
- Top Microsoft System Design Interview Questions
- Top Meta (Facebook) System Design Interview Questions
- Top Netflix System Design Interview Questions
- Top Uber System Design Interview Questions
- Top Google System Design Interview Questions
- Top Apple System Design Interview Questions
- Top Airbnb System Design Interview Questions
- Top 10 System Design Interview Questions
- Mobile App System Design Interview Questions
- Top 20 Stripe System Design Interview Questions
- Top Shopify System Design Interview Questions
- Top 20 System Design Interview Questions
- Top Advanced System Design Questions
- Most-Frequented System Design Questions in Big Tech Interviews
- What Interviewers Look for in System Design Questions
- Critical System Design Questions to Crack Any Tech Interview
- Top 20 API Design Questions for System Design Interviews
- Top 10 Steps to Create a System Design Portfolio for Developers
How to Debug JavaScript Code Like a Pro | Expert Guide
Introduction
Debugging JavaScript can feel like solving a mystery. One minute your code works perfectly, and the next, it’s throwing errors you’ve never seen before. But don’t worry—every developer faces this challenge. In fact, a study found that developers spend up to 50% of their time debugging code. Want to cut that time in half? Sign up for our free JavaScript debugging course to sharpen your skills!
Let’s dive in and learn how to debug JavaScript like a pro.
Understanding JavaScript Errors
Types of JavaScript Errors
JavaScript errors tell you exactly where things went wrong. But to fix them, you need to understand what they mean.
Syntax Errors
These occur when the JavaScript engine encounters incorrect syntax.
- Example: console.log(“Hello World’ (missing closing quotation mark)
Runtime Errors
These happen during execution, such as calling undefined functions.
- Example: undefinedVariable(); // ReferenceError: undefinedVariable is not defined
Logical Errors
Your code runs but doesn’t produce the expected result.
- Example: if (score = 100) { console.log(“Win!”); } // Assignment instead of comparison
“The first step to debugging is accepting that you’ll make mistakes.” — Sarah Drasner, VP of Developer Experience at Netlify
Using console.log Like a Pro
console.log Best Practices
While console.log is helpful, excessive use can clutter your console. Instead:
- Use console.table for structured data (arrays, objects).
- Label your logs: console.log(‘User Data:’, userData);
- Measure execution time with console.time() and console.timeEnd().
Helpful Console Methods
Method | Purpose |
console.error() | Highlight critical errors |
console.warn() | Display warnings |
console.time() | Measure code execution speed |

Mastering Browser Developer Tools
Modern browsers come with powerful built-in developer tools to debug JavaScript efficiently.
The Sources Panel
The Sources tab in Chrome DevTools allows you to:
- View all loaded scripts.
- Set breakpoints to pause code execution.
- Edit JavaScript code live.
Setting Breakpoints in DevTools
- Line-of-Code Breakpoints: Pause at a specific line to inspect values.
- Conditional Breakpoints: Set conditions for stopping execution.
- DOM Change Breakpoints: Pause when an element’s attributes change.
Stat: Developers who use breakpoints debug 40% faster (Chrome DevTools Report, 2022).
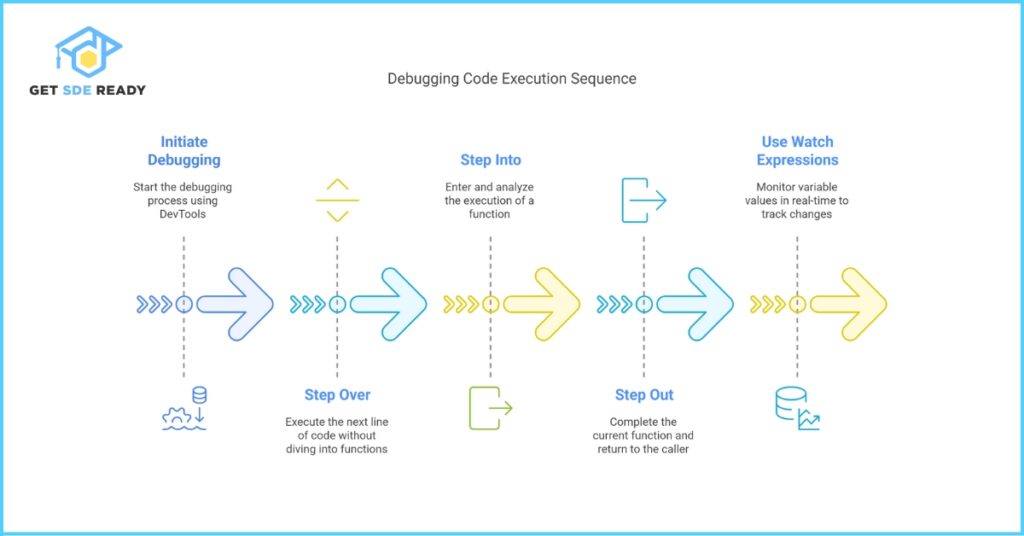
Advanced Debugging Techniques
Step Through Code Execution
Use these DevTools buttons to analyze your code step by step:
- Step Over: Run the next function but skip its details.
- Step Into: Dive into function calls.
- Step Out: Finish the current function and return to the caller.
Using Watch Expressions
The Watch panel in DevTools allows you to track variable values in real time.
- Example: Monitor cartItems.length to debug an issue with cart updates.
Common JavaScript Mistakes to Avoid
- Ignoring Console Errors: Always check for red error messages.
- Misusing == Instead of ===: Triple equals checks both value and type.
- Memory Leaks: Unused variables, event listeners, and setInterval not being cleared.
Best Practices for Debugging
- Write Testable Code: Break functions into small, single-purpose units.
- Leverage Linters: Tools like ESLint highlight common mistakes.
- Pair Programming: A second set of eyes helps spot errors faster.
Also Read: Low-Level Design of WhatsApp Messaging
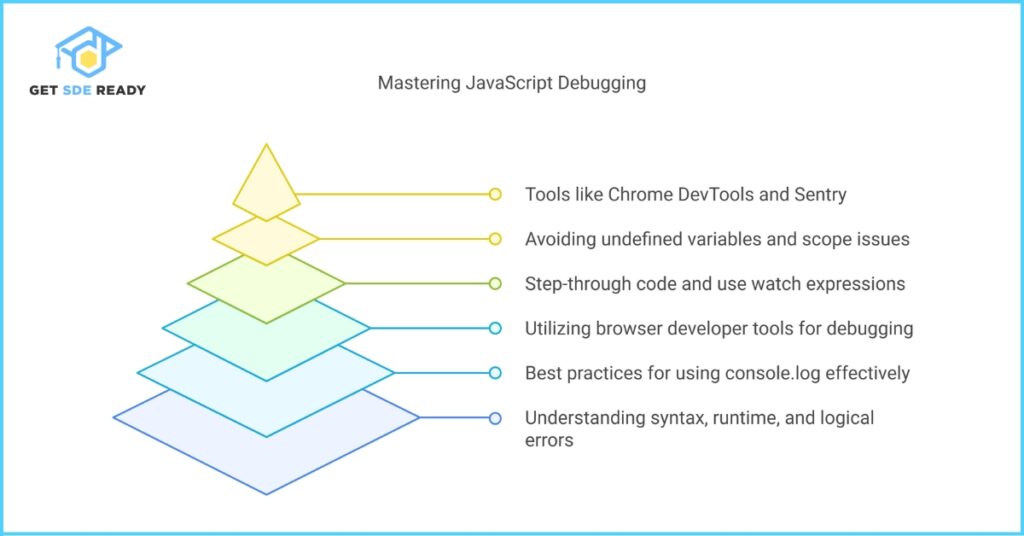
Top Debugging Tools for JavaScript
Tool | Purpose |
Chrome DevTools | Real-time debugging & profiling |
VS Code Debugger | Integrated IDE debugging |
Sentry | Production error tracking |
Frequently Encountered JavaScript Errors
- Undefined Variables: Trying to use a variable that hasn’t been declared.
- Incorrect Scope Usage: Accessing a variable outside its scope.
- Type Errors: Mismatching data types in operations.
- Asynchronous Bugs: Handling async operations incorrectly.
How can I improve my debugging skills?
Practice using DevTools, set breakpoints, and experiment with different debugging methods. Try our Web Development Course.
What are the most common JavaScript errors?
Undefined variables, syntax errors, and incorrect function usage are among the most frequent.
How can I track variable values in real-time?
Use the Watch Expressions feature in DevTools to monitor specific variables dynamically.
How do professional developers debug efficiently?
They use a mix of breakpoints, console methods, and structured code to debug faster. Take our Debugging Masterclass for expert insights.

DSA, High & Low Level System Designs
- 85+ Live Classes & Recordings
- 24*7 Live Doubt Support
- 400+ DSA Practice Questions
- Comprehensive Notes
- HackerRank Tests & Quizzes
- Topic-wise Quizzes
- Case Studies
- Access to Global Peer Community
Buy for 52% OFF
₹25,000.00 ₹11,999.00
Accelerate your Path to a Product based Career
Boost your career or get hired at top product-based companies by joining our expertly crafted courses. Gain practical skills and real-world knowledge to help you succeed.

Data Analytics
- 20+ Live Classes & Recordings
- 24*7 Live Doubt Support
- 15+ Hands-on Live Projects
- Comprehensive Notes
- Real-world Tools & Technologies
- Access to Global Peer Community
- Interview Prep Material
- Placement Assistance
Buy for 70% OFF
₹9,999.00 ₹2,999.00
SDE 360: Master DSA, System Design, AI & Behavioural
- 100+ Live Classes & Recordings
- 24*7 Live Doubt Support
- 400+ DSA Practice Questions
- Comprehensive Notes
- HackerRank Tests & Quizzes
- Topic-wise Quizzes
- Case Studies
- Access to Global Peer Community
Buy for 50% OFF
₹39,999.00 ₹19,999.00

Fast-Track to Full Spectrum Software Engineering
- 120+ Live Classes & Recordings
- 24*7 Live Doubt Support
- 400+ DSA Practice Questions
- Comprehensive Notes
- HackerRank Tests & Quizzes
- 12+ live Projects & Deployments
- Case Studies
- Access to Global Peer Community
Buy for 51% OFF
₹35,000.00 ₹16,999.00
DSA, High & Low Level System Designs
- 85+ Live Classes & Recordings
- 24*7 Live Doubt Support
- 400+ DSA Practice Questions
- Comprehensive Notes
- HackerRank Tests & Quizzes
- Topic-wise Quizzes
- Case Studies
- Access to Global Peer Community
Buy for 52% OFF
₹25,000.00 ₹11,999.00

Mastering Mern Stack (WEB DEVELOPMENT)
- 65+ Live Classes & Recordings
- 24*7 Live Doubt Support
- 12+ Hands-on Live Projects & Deployments
- Comprehensive Notes & Quizzes
- Real-world Tools & Technologies
- Access to Global Peer Community
- Interview Prep Material
- Placement Assistance
Buy for 53% OFF
₹15,000.00 ₹6,999.00

Mastering Data Structures & Algorithms
- 65+ Live Classes & Recordings
- 24*7 Live Doubt Support
- 400+ DSA Practice Questions
- Comprehensive Notes
- HackerRank Tests
- Access to Global Peer Community
- Topic-wise Quizzes
- Interview Prep Material
Buy for 40% OFF
₹9,999.00 ₹5,999.00
Reach Out Now
If you have any queries, please fill out this form. We will surely reach out to you.
Contact Email
Reach us at the following email address.
arun@getsdeready.com
Phone Number
You can reach us by phone as well.
+91-97737 28034
Our Location
Rohini, Sector-3, Delhi-110085
