Introduction to High-Level System Design
System Design Fundamentals
- Functional vs. Non-Functional Requirements
- Scalability, Availability, and Reliability
- Latency and Throughput Considerations
- Load Balancing Strategies
Architectural Patterns
- Monolithic vs. Microservices Architecture
- Layered Architecture
- Event-Driven Architecture
- Serverless Architecture
- Model-View-Controller (MVC) Pattern
- CQRS (Command Query Responsibility Segregation)
Scaling Strategies
- Vertical Scaling vs. Horizontal Scaling
- Sharding and Partitioning
- Data Replication and Consistency Models
- Load Balancing Strategies
- CDN and Edge Computing
Database Design in HLD
- SQL vs. NoSQL Databases
- CAP Theorem and its Impact on System Design
- Database Indexing and Query Optimization
- Database Sharding and Partitioning
- Replication Strategies
API Design and Communication
Caching Strategies
- Types of Caching
- Cache Invalidation Strategies
- Redis vs. Memcached
- Cache-Aside, Write-Through, and Write-Behind Strategies
Message Queues and Event-Driven Systems
- Kafka vs. RabbitMQ vs. SQS
- Pub-Sub vs. Point-to-Point Messaging
- Handling Asynchronous Workloads
- Eventual Consistency in Distributed Systems
Security in System Design
Observability and Monitoring
- Logging Strategies (ELK Stack, Prometheus, Grafana)
- API Security Best Practices
- Secure Data Storage and Access Control
- DDoS Protection and Rate Limiting
Real-World System Design Case Studies
- Distributed locking (Locking and its Types)
- Memory leaks and Out of memory issues
- HLD of YouTube
- HLD of WhatsApp
System Design Interview Questions
- Adobe System Design Interview Questions
- Top Atlassian System Design Interview Questions
- Top Amazon System Design Interview Questions
- Top Microsoft System Design Interview Questions
- Top Meta (Facebook) System Design Interview Questions
- Top Netflix System Design Interview Questions
- Top Uber System Design Interview Questions
- Top Google System Design Interview Questions
- Top Apple System Design Interview Questions
- Top Airbnb System Design Interview Questions
- Top 10 System Design Interview Questions
- Mobile App System Design Interview Questions
- Top 20 Stripe System Design Interview Questions
- Top Shopify System Design Interview Questions
- Top 20 System Design Interview Questions
- Top Advanced System Design Questions
- Most-Frequented System Design Questions in Big Tech Interviews
- What Interviewers Look for in System Design Questions
- Critical System Design Questions to Crack Any Tech Interview
- Top 20 API Design Questions for System Design Interviews
- Top 10 Steps to Create a System Design Portfolio for Developers
Metrics and Alerts for High Availability: Ensuring Continuous System Uptime
Maintaining high availability means keeping your system online and responsive under any circumstance. By combining proactive monitoring, intelligent alerts, and automated responses, you can minimize downtime and deliver uninterrupted service. This guide explains the key concepts, tools, and best practices to optimize your high availability architecture.
What Is High Availability?
High availability (HA) refers to the design and implementation strategies that ensure a system remains accessible with minimal downtime—ideally achieving 99.99 percent uptime. To sustain this level of reliability, you must:
- Monitor system health in real time
- Detect anomalies before they become outages
- Automatically scale or recover resources when thresholds are breached
By focusing on metrics and alerts, you create a resilient infrastructure that adapts to load spikes and hardware failures.
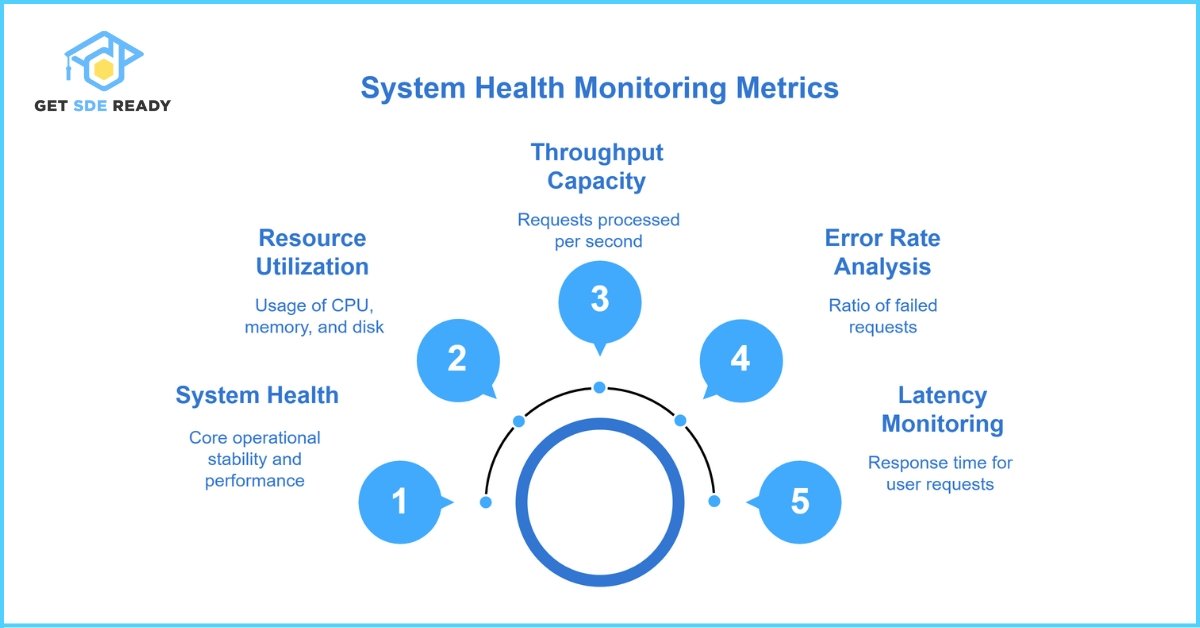
Essential Metrics for System Health Monitoring
Which Metrics Should You Track to Prevent Downtime?
- Uptime Percentage
Measures the total time your system is operational. Aim for at least 99.99 percent to meet enterprise SLAs. - Latency Monitoring
Tracks response time for user requests. High latency impacts user experience—monitor average and p 95 values. - Error Rate Analysis
Calculates the ratio of failed requests. A sudden increase indicates potential service degradation. - Throughput Capacity
Counts requests processed per second. Ensuring adequate throughput prevents bottlenecks during traffic surges. - Resource Utilization
Observes CPU, memory, and disk usage. Proactive alerts at 80 percent utilization avert resource exhaustion.
To deepen your understanding of real-time metrics, explore our high availability crash course for guided hands‑on labs on monitoring fundamentals.
Best Monitoring Tools for Real‑Time Metrics
What Are the Top Tools to Monitor High Availability Metrics?
- Prometheus
An open‑source metrics collector that supports multidimensional data models and powerful queries. - Grafana
A visualization platform that integrates seamlessly with Prometheus for customizable dashboards. - Datadog
A SaaS solution that correlates metrics, logs, and traces, providing a unified view of system performance. - New Relic
Offers deep application performance monitoring and end‑user monitoring for full‑stack observability. - Nagios
A mature monitoring framework ideal for infrastructure health checks and custom plugin development.
For application‑level monitoring and performance tuning, consider enrolling in our comprehensive web development course to learn how to instrument code for detailed insights.
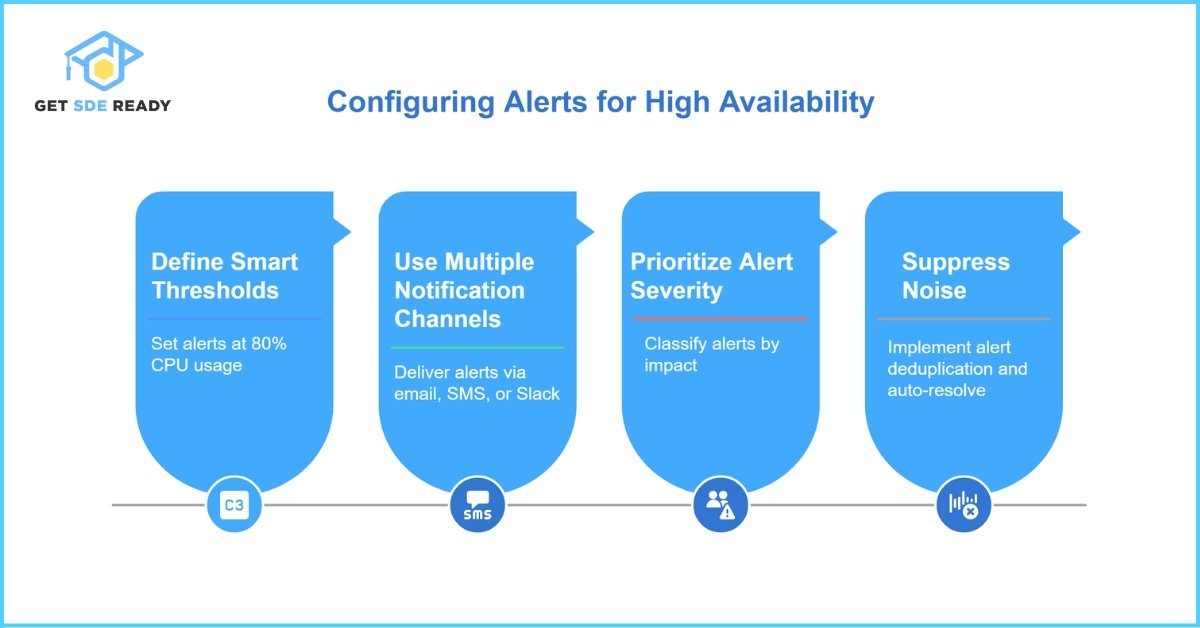
Configuring Alerts to Stop Outages Before They Spread
How Do You Set Up Alerts to Maintain High Availability?
- Define Smart Thresholds
Trigger alerts at resource utilization levels (for example 80 percent CPU) rather than waiting for critical limits. - Use Multiple Notification Channels
Deliver alerts via email, SMS, or collaboration platforms like Slack to ensure rapid response. - Prioritize Alert Severity
Classify alerts by impact—urgent (service‑down), high (error‑rate spike), medium (performance dip). - Suppress Noise to Avoid Fatigue
Implement alert deduplication and auto‑resolve to prevent overwhelming on‑call teams.
Manage alert schedules and escalation policies effectively by reviewing our PagerDuty integration guide for on‑call best practices.
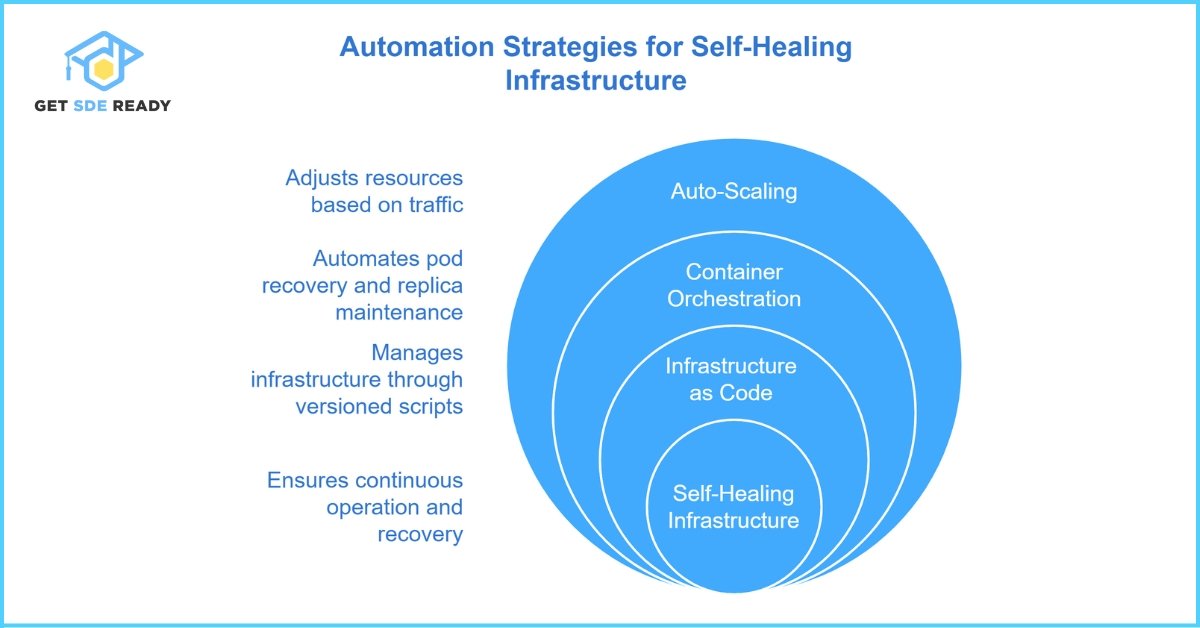
Automation Strategies for Self‑Healing Infrastructure
How Can Automation Enhance Your High Availability Architecture?
- Auto‑Scaling
Dynamically adjust resource capacity in response to traffic patterns using tools like AWS CloudWatch. - Container Orchestration
Employ platforms such as Kubernetes to auto‑recover failed pods and maintain service replicas. - Infrastructure as Code
Use Terraform scripts to version and deploy infrastructure, ensuring consistent environments and rapid recovery.
To master automated recovery workflows, explore the Master DSA, Web Dev & System Design program for end‑to‑end infrastructure training.

DSA, High & Low Level System Designs
- 85+ Live Classes & Recordings
- 24*7 Live Doubt Support
- 400+ DSA Practice Questions
- Comprehensive Notes
- HackerRank Tests & Quizzes
- Topic-wise Quizzes
- Case Studies
- Access to Global Peer Community
Buy for 52% OFF
₹25,000.00 ₹11,999.00
Accelerate your Path to a Product based Career
Boost your career or get hired at top product-based companies by joining our expertly crafted courses. Gain practical skills and real-world knowledge to help you succeed.
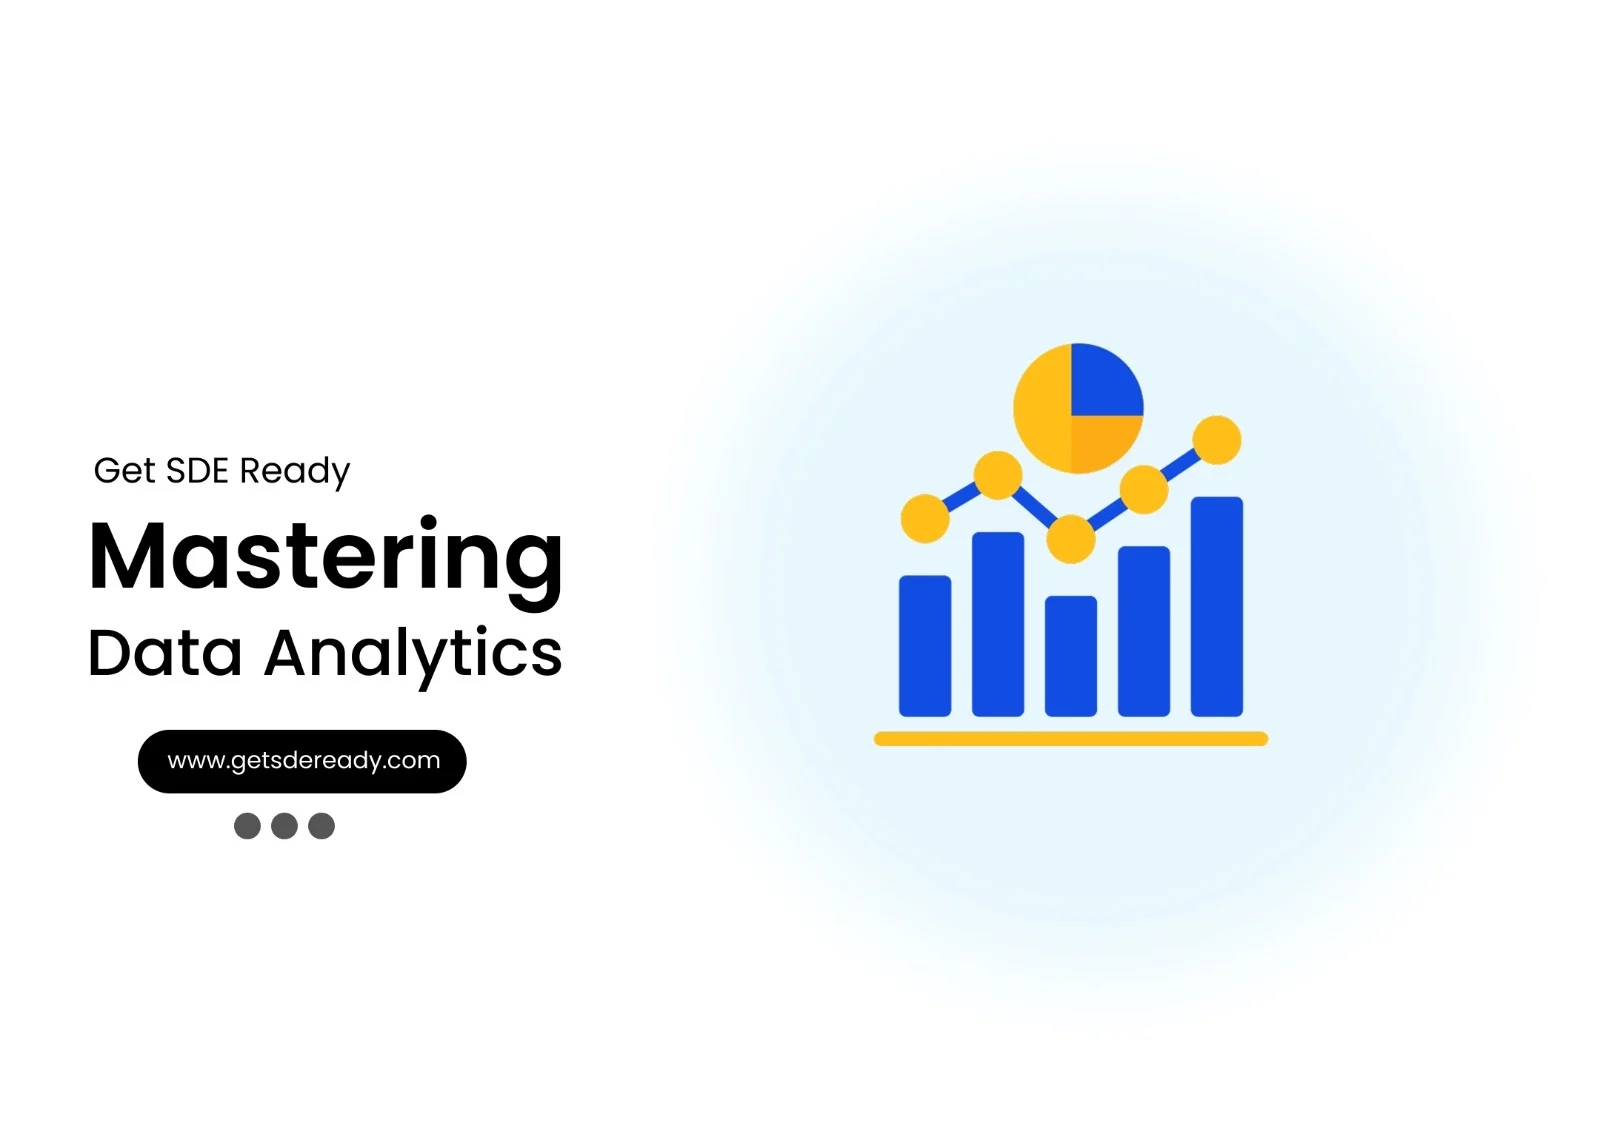
Data Analytics
- 20+ Live Classes & Recordings
- 24*7 Live Doubt Support
- 15+ Hands-on Live Projects
- Comprehensive Notes
- Real-world Tools & Technologies
- Access to Global Peer Community
- Interview Prep Material
- Placement Assistance
Buy for 70% OFF
₹9,999.00 ₹2,999.00
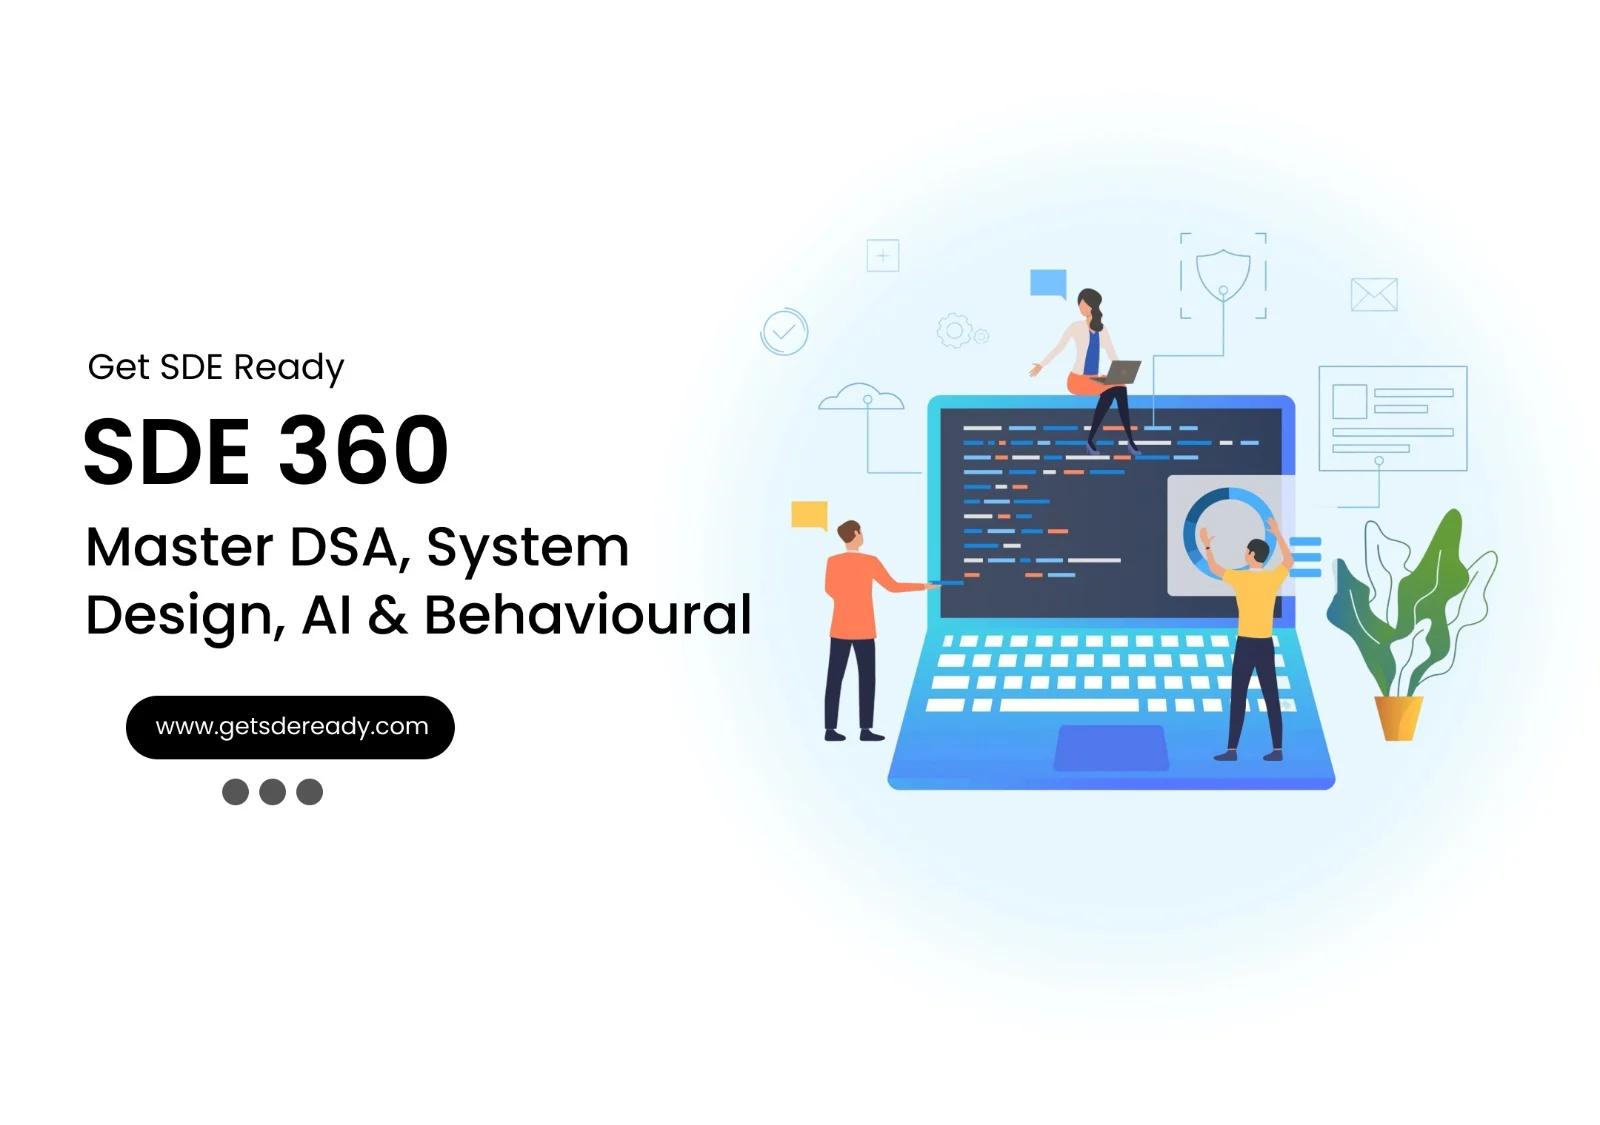
SDE 360: Master DSA, System Design, AI & Behavioural
- 100+ Live Classes & Recordings
- 24*7 Live Doubt Support
- 400+ DSA Practice Questions
- Comprehensive Notes
- HackerRank Tests & Quizzes
- Topic-wise Quizzes
- Case Studies
- Access to Global Peer Community
Buy for 50% OFF
₹39,999.00 ₹19,999.00
Fast-Track to Full Spectrum Software Engineering
- 120+ Live Classes & Recordings
- 24*7 Live Doubt Support
- 400+ DSA Practice Questions
- Comprehensive Notes
- HackerRank Tests & Quizzes
- 12+ live Projects & Deployments
- Case Studies
- Access to Global Peer Community
Buy for 51% OFF
₹35,000.00 ₹16,999.00
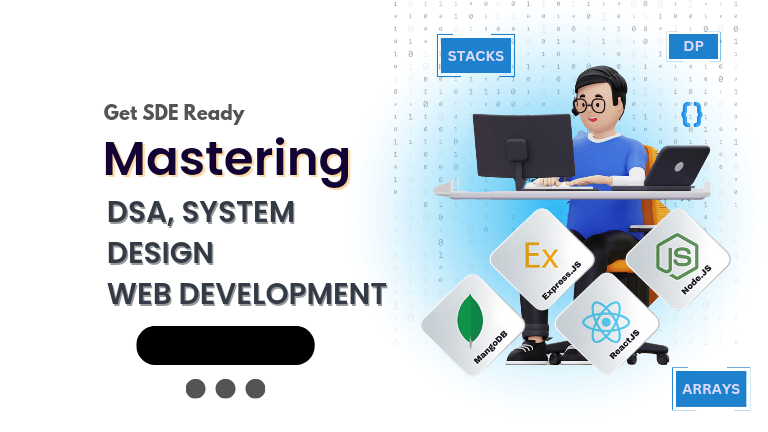
DSA, High & Low Level System Designs
- 85+ Live Classes & Recordings
- 24*7 Live Doubt Support
- 400+ DSA Practice Questions
- Comprehensive Notes
- HackerRank Tests & Quizzes
- Topic-wise Quizzes
- Case Studies
- Access to Global Peer Community
Buy for 52% OFF
₹25,000.00 ₹11,999.00
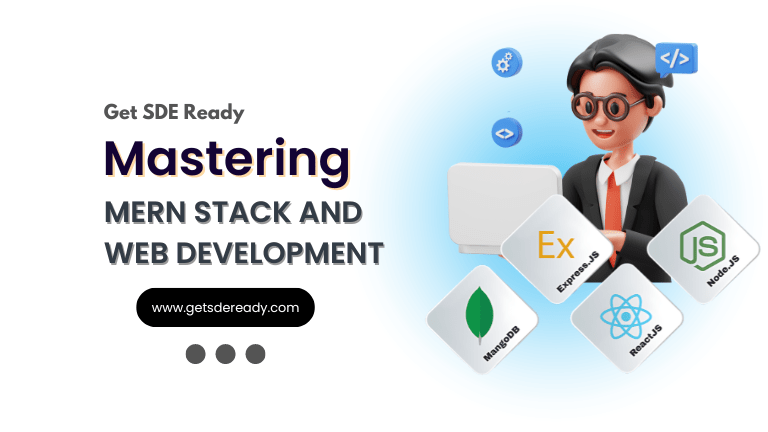
Mastering Mern Stack (WEB DEVELOPMENT)
- 65+ Live Classes & Recordings
- 24*7 Live Doubt Support
- 12+ Hands-on Live Projects & Deployments
- Comprehensive Notes & Quizzes
- Real-world Tools & Technologies
- Access to Global Peer Community
- Interview Prep Material
- Placement Assistance
Buy for 53% OFF
₹15,000.00 ₹6,999.00
Mastering Data Structures & Algorithms
- 65+ Live Classes & Recordings
- 24*7 Live Doubt Support
- 400+ DSA Practice Questions
- Comprehensive Notes
- HackerRank Tests
- Access to Global Peer Community
- Topic-wise Quizzes
- Interview Prep Material
Buy for 40% OFF
₹9,999.00 ₹5,999.00
Reach Out Now
If you have any queries, please fill out this form. We will surely reach out to you.
Contact Email
Reach us at the following email address.
arun@getsdeready.com
Phone Number
You can reach us by phone as well.
+91-97737 28034
Our Location
Rohini, Sector-3, Delhi-110085
